fylm.ai offers you three different video scopes so you can colour grade your images more accurately and with confidence.
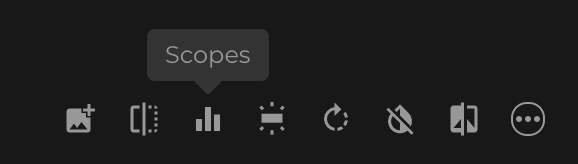
To access the scopes window click on the Scopes button in the bottom part of the Main Viewer Area.
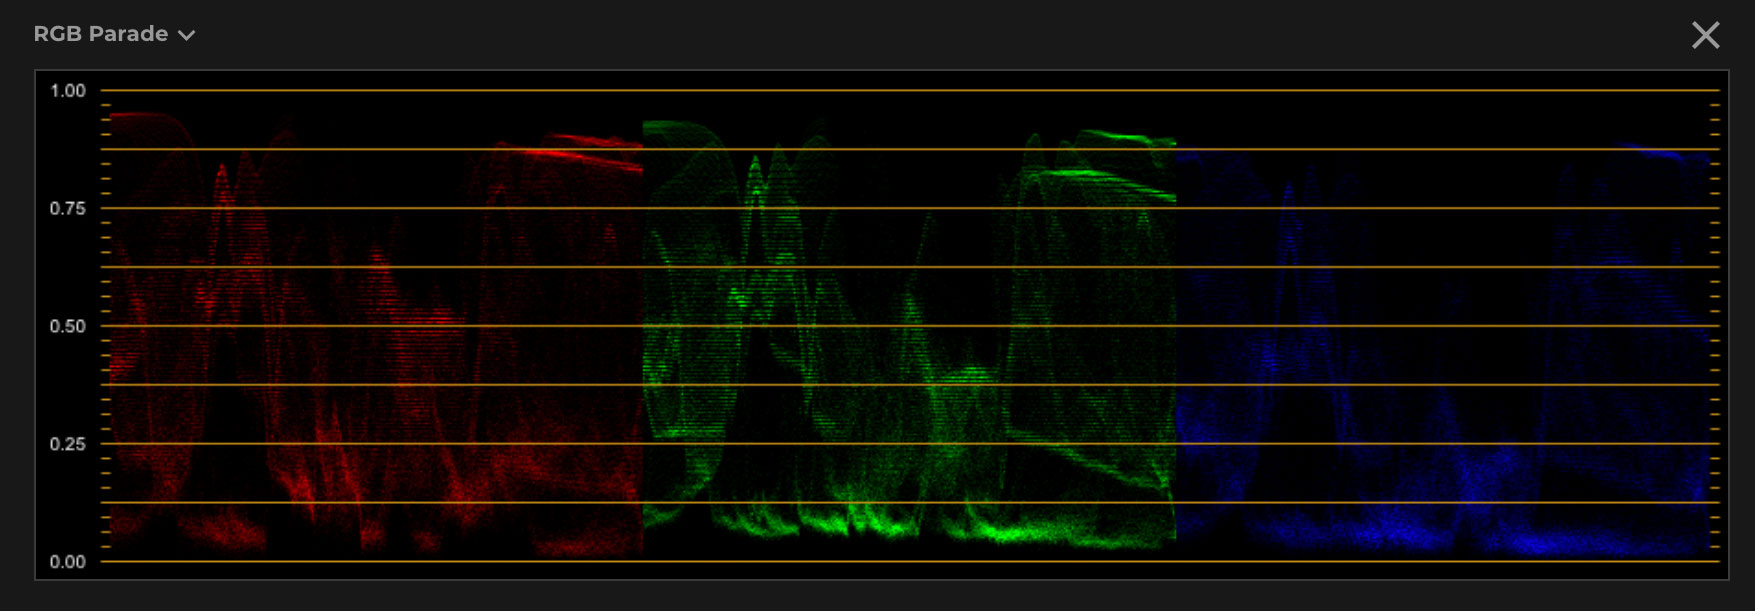
If this is the first time you are opening the Scopes window, the first scope to show is RGB Parade. On consequent use of the Scopes window, the last used Scope is the one that shows.
To change the scope displayed, use the drop down menu in the upper left part of the scopes window and select the desired scope.
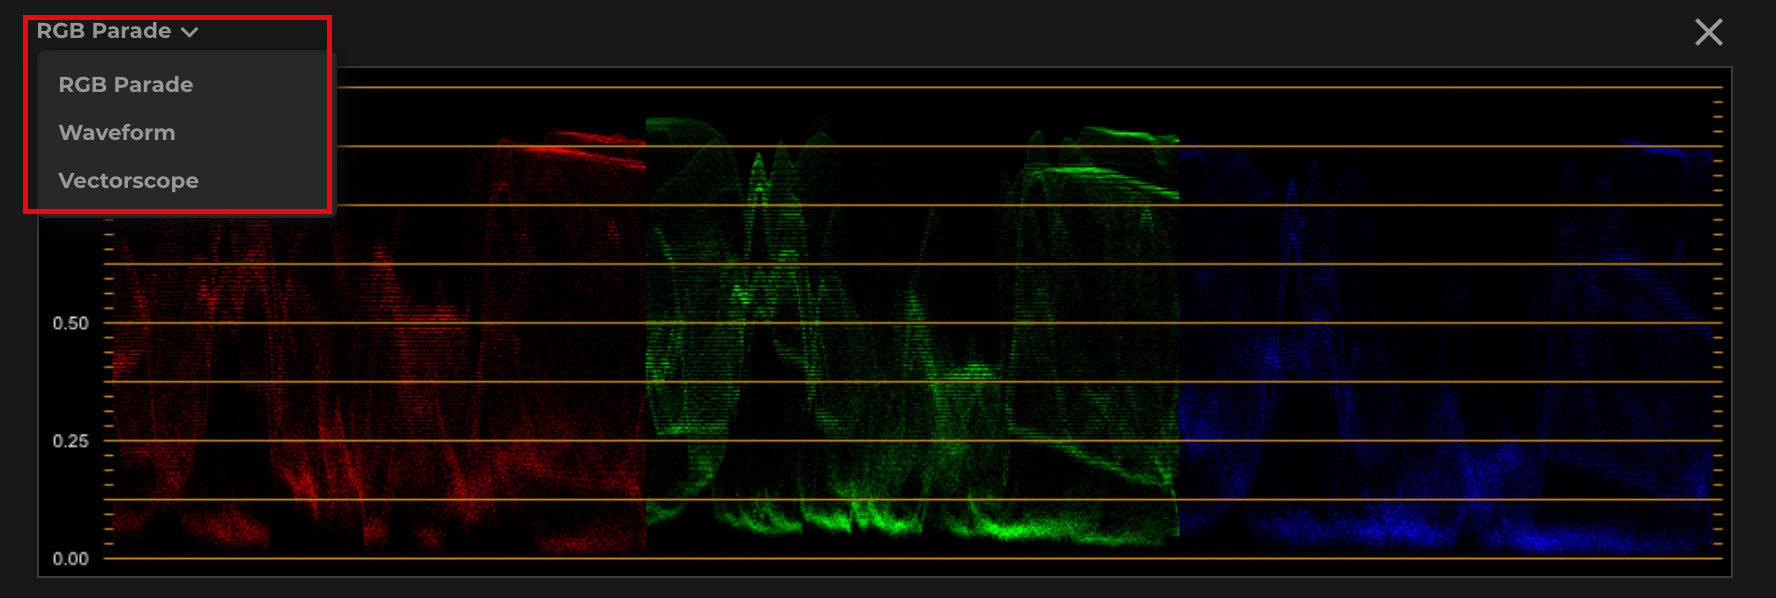
Three different scopes are available:
- Waveform
- RGB Parade
- Vectorscope
Waveform
Waveform scope allows you to see how dark or bright the image is across your image. It shows the image’s brightness expressed as a wavefrom.
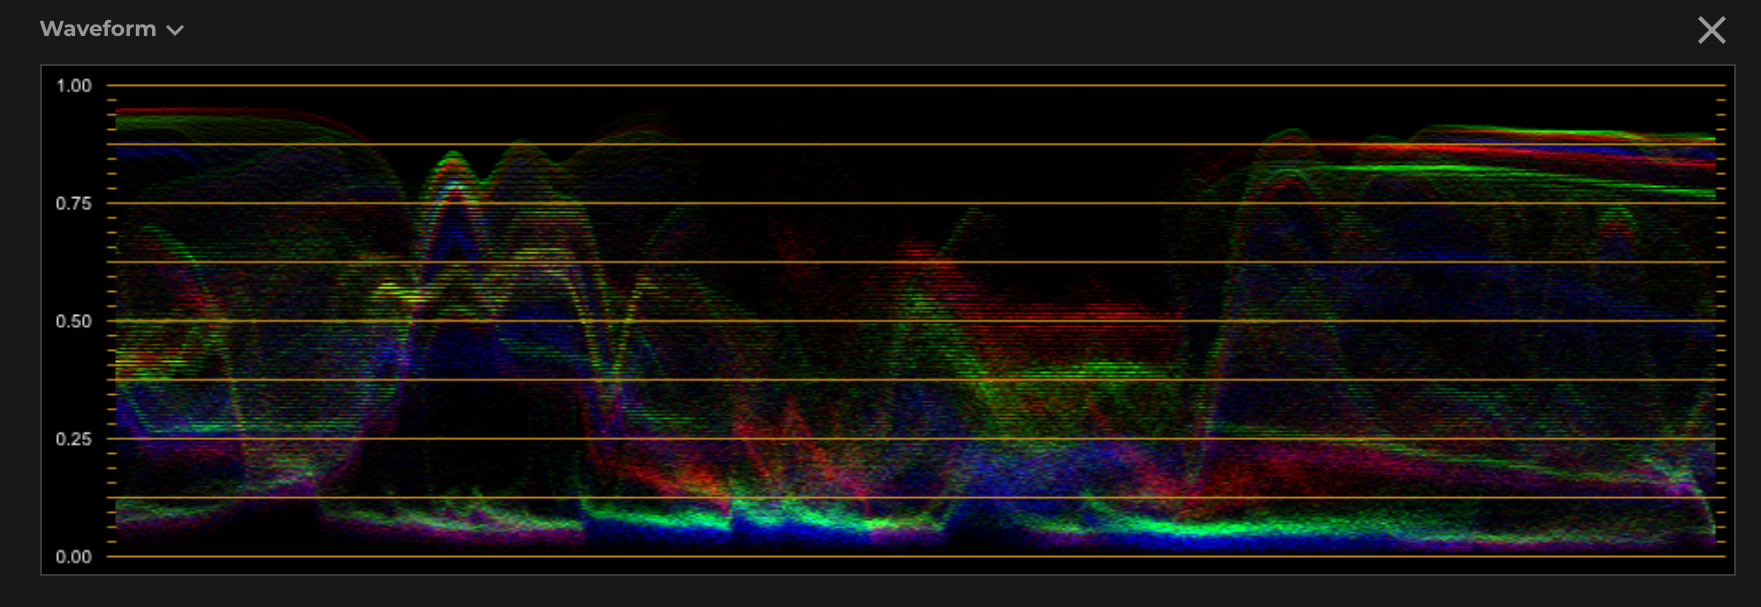
At the bottom of the range you will se a value of 0. 0 represents black. 1 represents white. Anything below 0 and above 1 is clipped as it’s “darker than black” and “whiter than white”. Waveform is adjusted according to the selected Output Device Transform. When using a different Output Device Transform the waveform will change as it will show the image’s brightness relative to the selected transform. A value which is clipped in Rec709 for example, is not clipped when using one of the HDR transforms.
When you look at the waveform, an important aspect you should remember is that left is left and right is right. Whatever is displayed on the left side of the waveform represents the left side of the image and vice versa. Whatever is located in the centre of the image will appear in the centre area of the waveform.
Here are a few examples of waveform so we can better understand how to read the scope.
Underexposed image
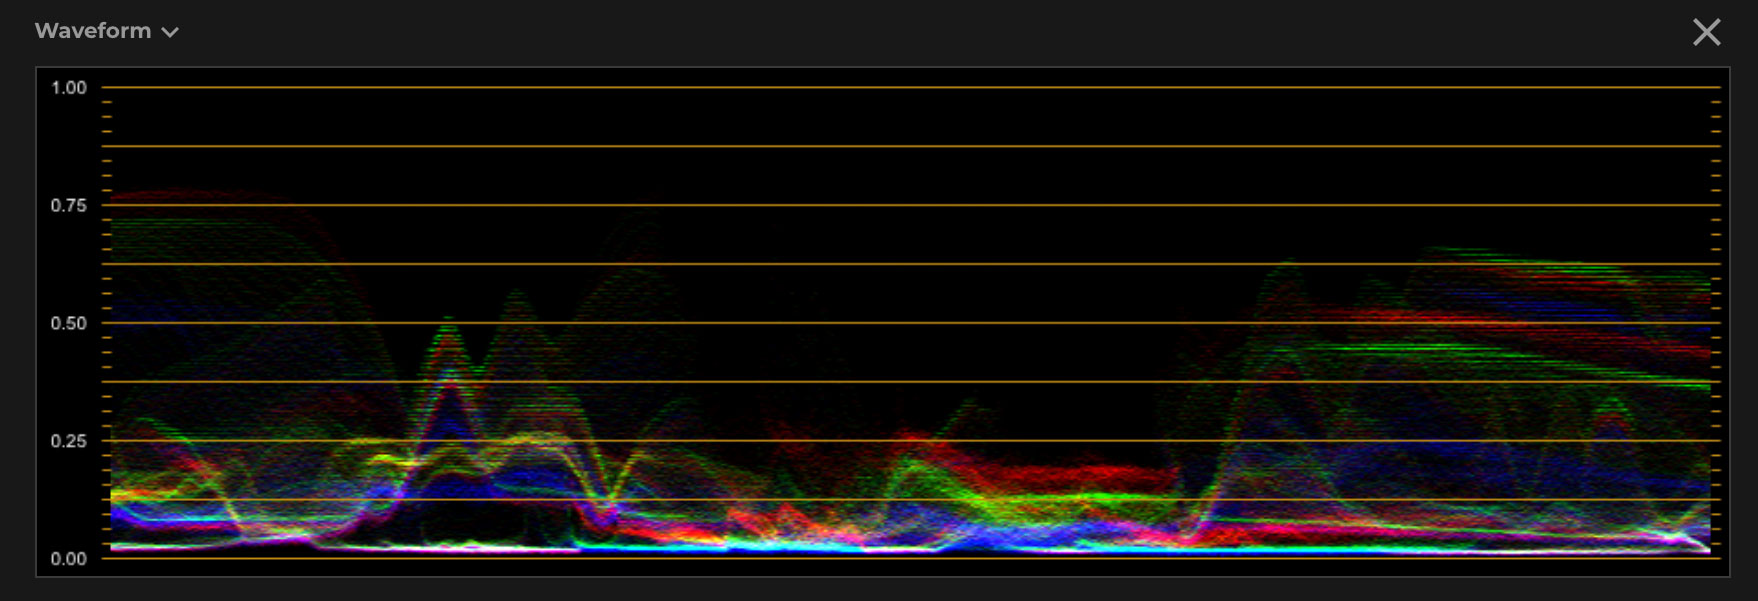
As we can see, most of the data is located at the bottom part of the waveform. The vast majority is in the 0-0.25 range. If we translate this to sRGB value this translates to 0-64 range. The brightest part of the image is at about 0.75 which translates to 191 in sRGB range. If this were a dusk shot, this waveform would probably be just about right, but for an image shot under “normal” lighting conditions this would mean the image is underexposed.
Overexposed image
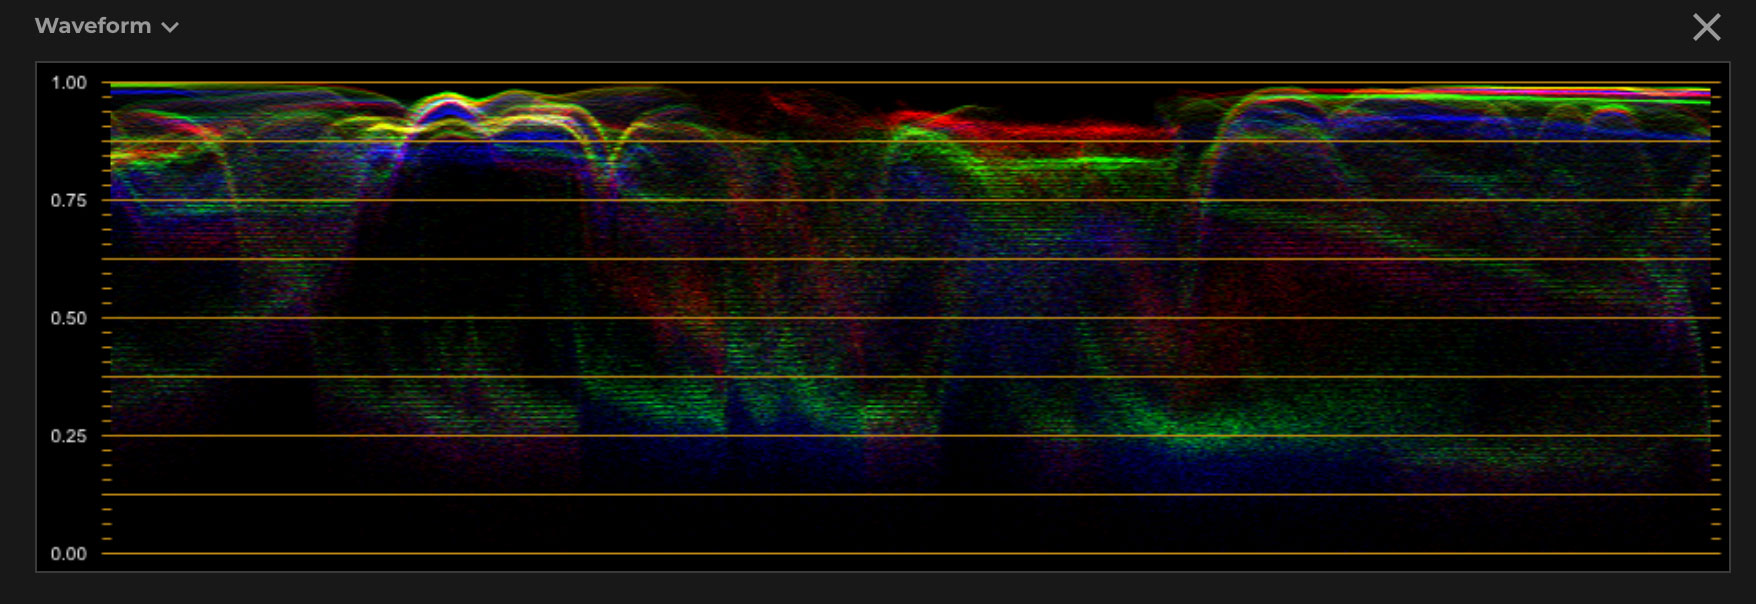
As we can see, most of the data is located at the upper part of the waveform. The vast majority is in the 0.25-1 range. If we translate this to sRGB value this translates to 64-255 range. The darkest part of the image is at about 0.15 which translates to 38 in sRGB range. This means that in this image we do not have anything that’s black, which usually doesn’t correspond with real life lighting conditions.
Correctly exposed image
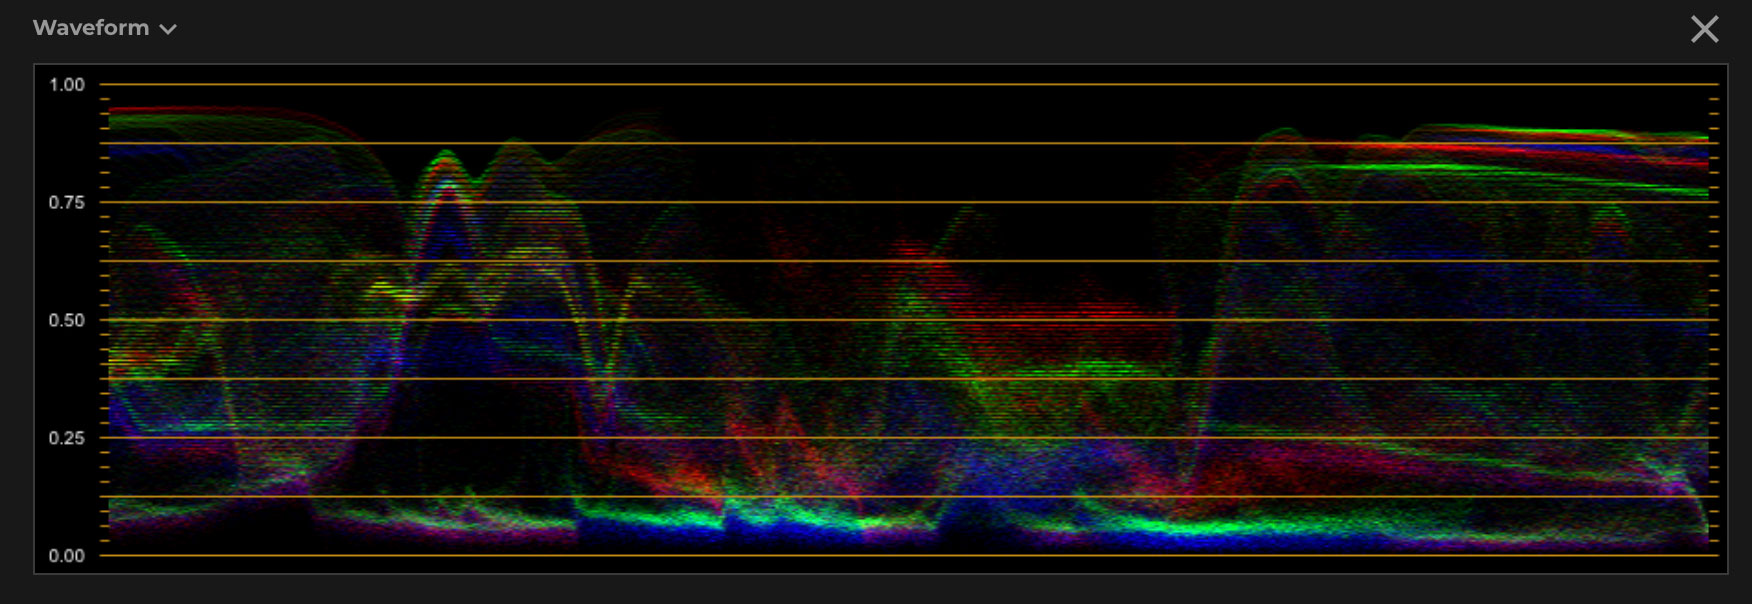
As we can see, most of the data is nicely spread from about 0.05 to 0.95. If we translate this to 8-bit sRGB value this translates to 12-243 range. The image has nice contrast, we have black and white objects and the overall exposure is correct. Bear in mind that “correct” exposure is a relative value and sometimes, depending on the lighting conditions, your waveform will not spread evenly from 0-1. For example, if you are shooting at dusk, usually you wouldn’t have bright white objects close to 1.
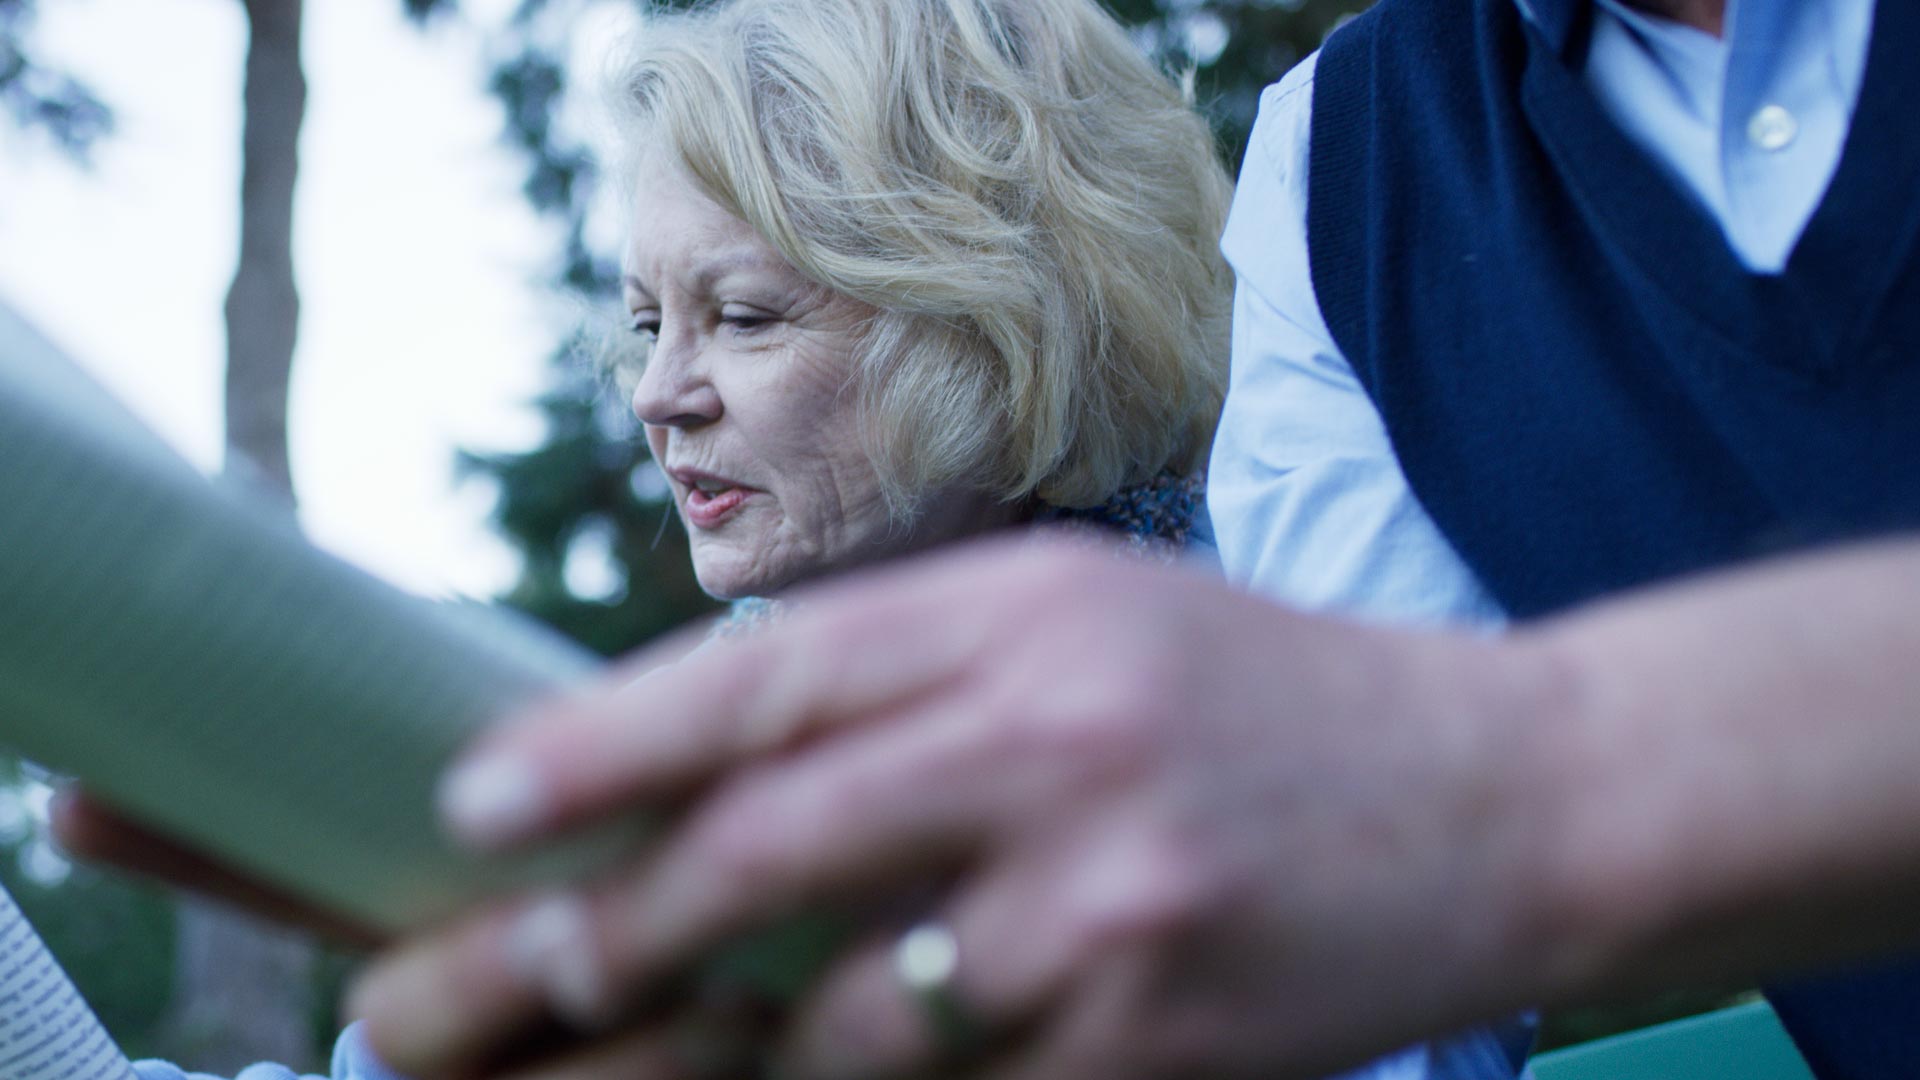
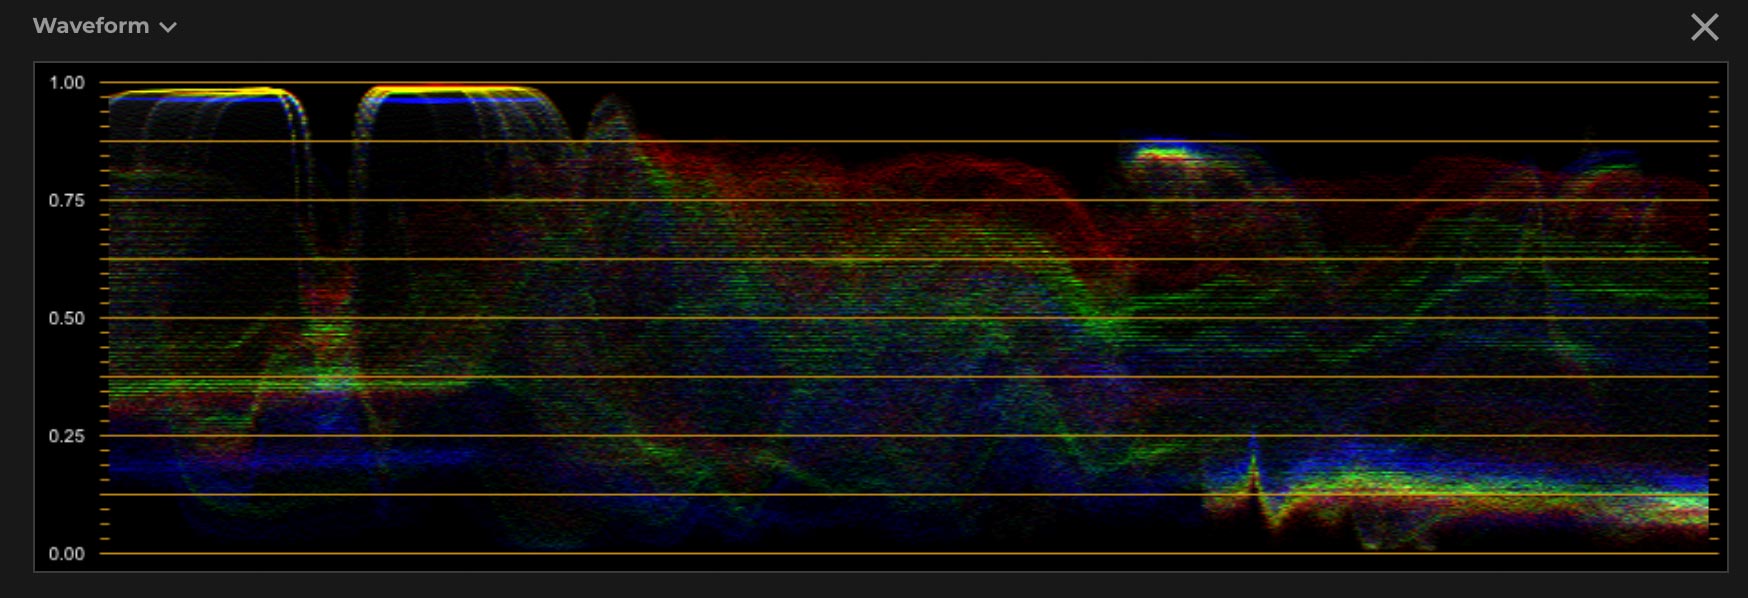
If you pay attention to the waveform, you can see that it displays the Red, Green and Blue channels separately over each other. In a perfectly white balanced image, the three waveforms would overlap completely. Let’s have a look at incorrectly white balanced image waveform.
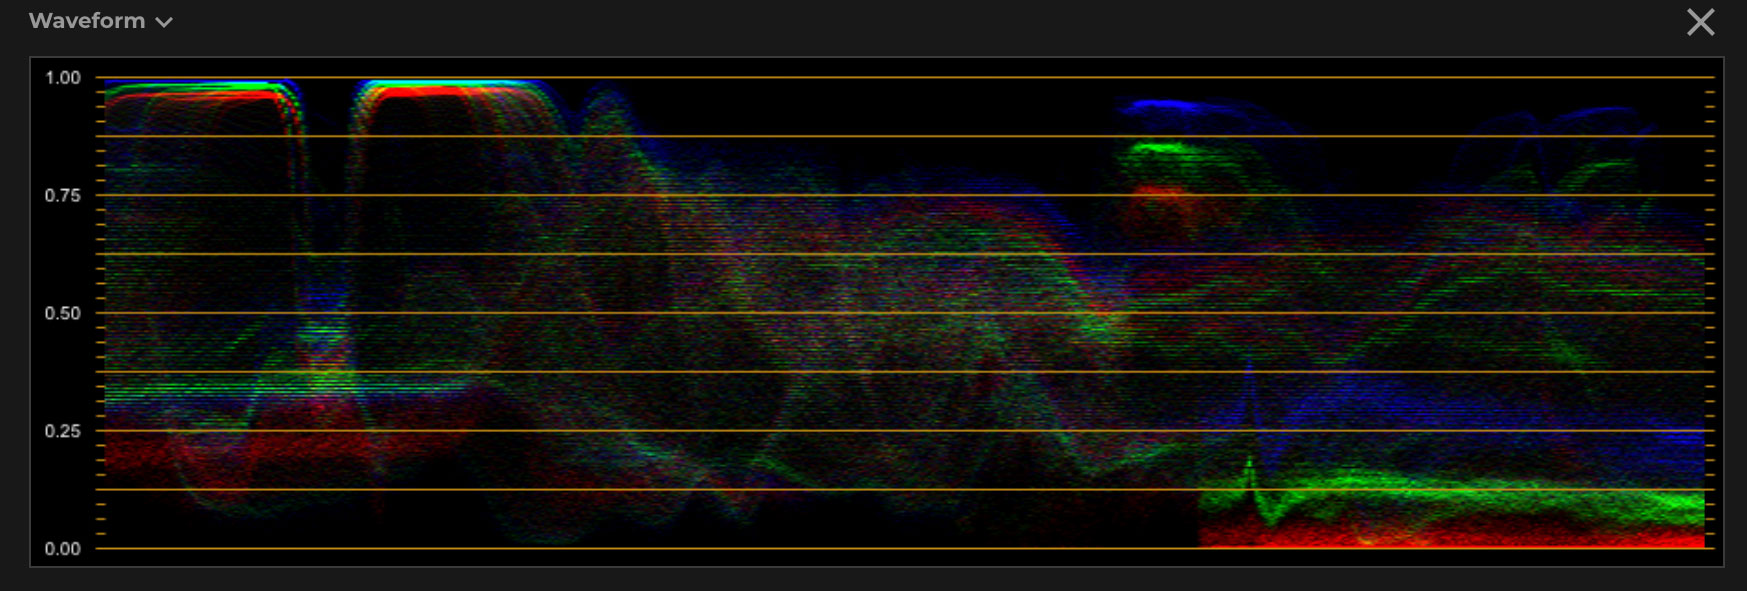
You can see that the blue and green channels are significantly more elevated than the red channel. And indeed, if we look at the image, we can see that it is too cold.
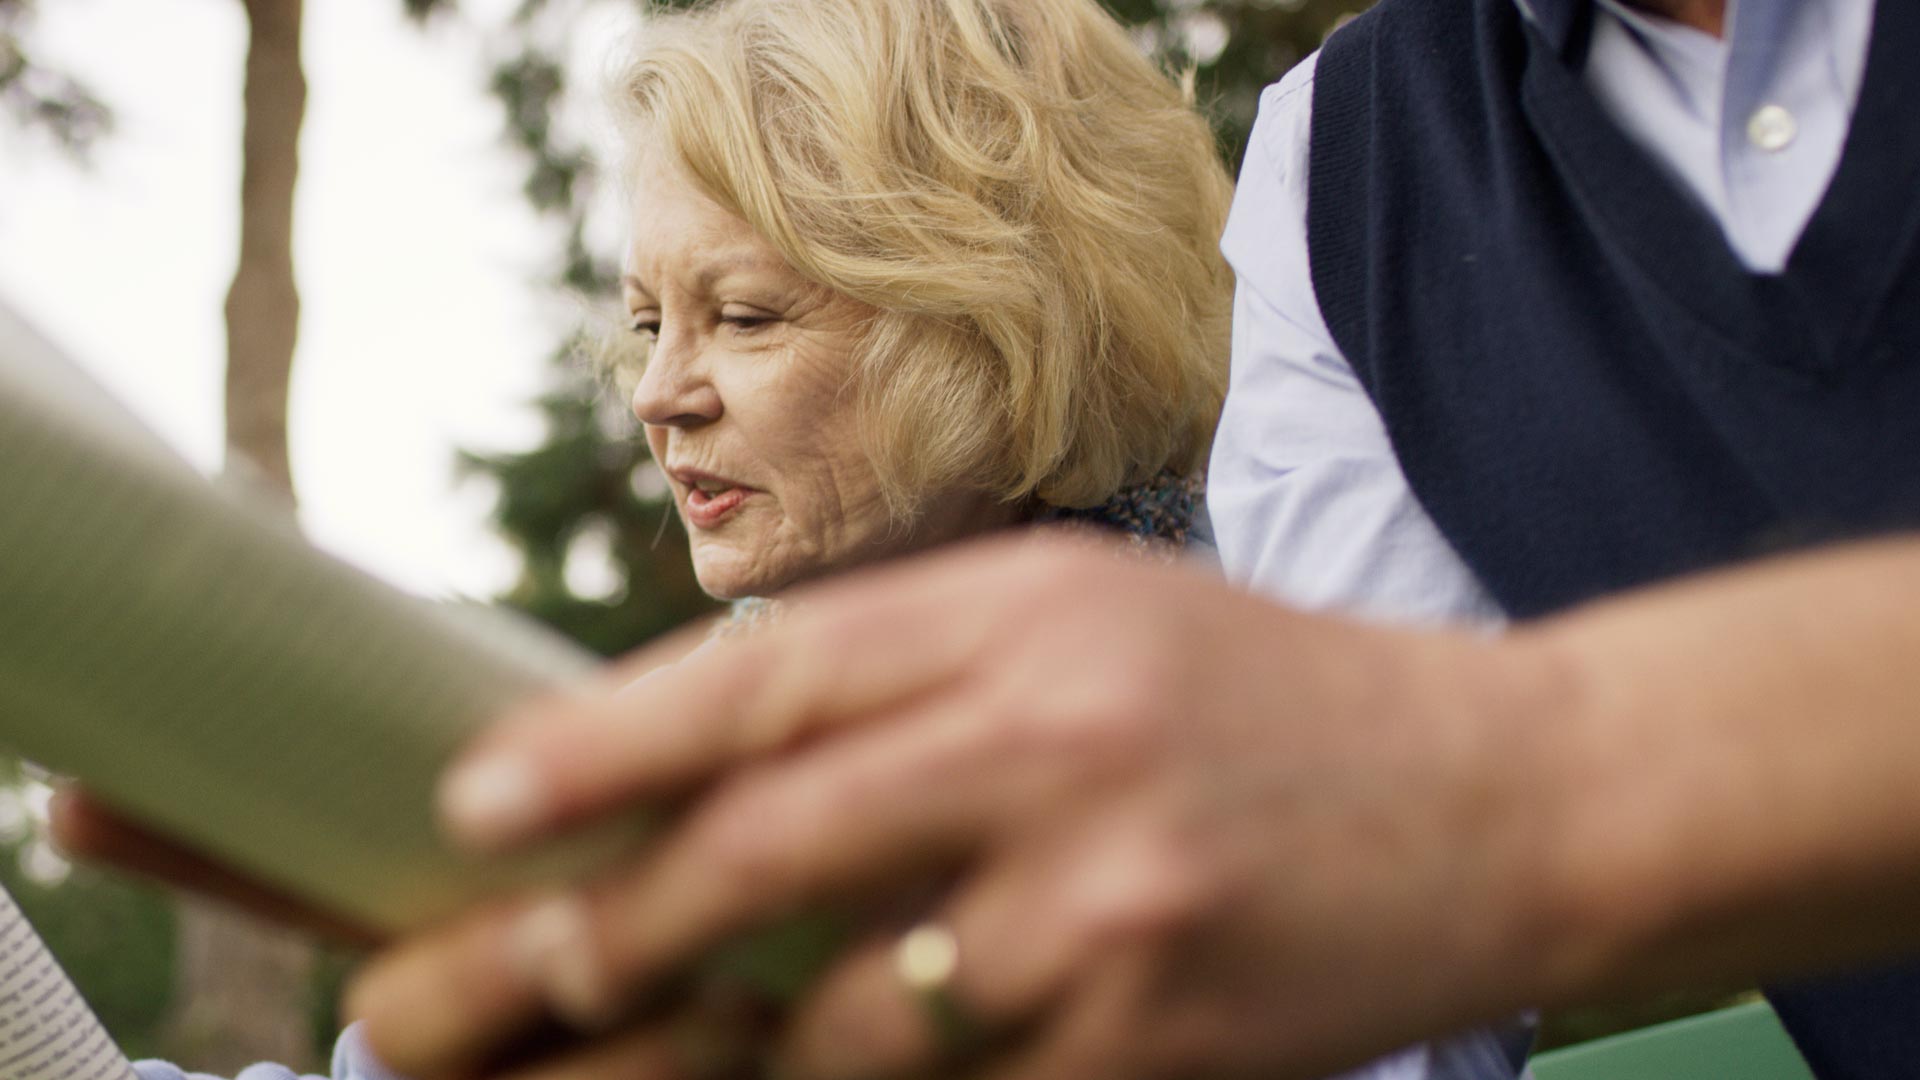
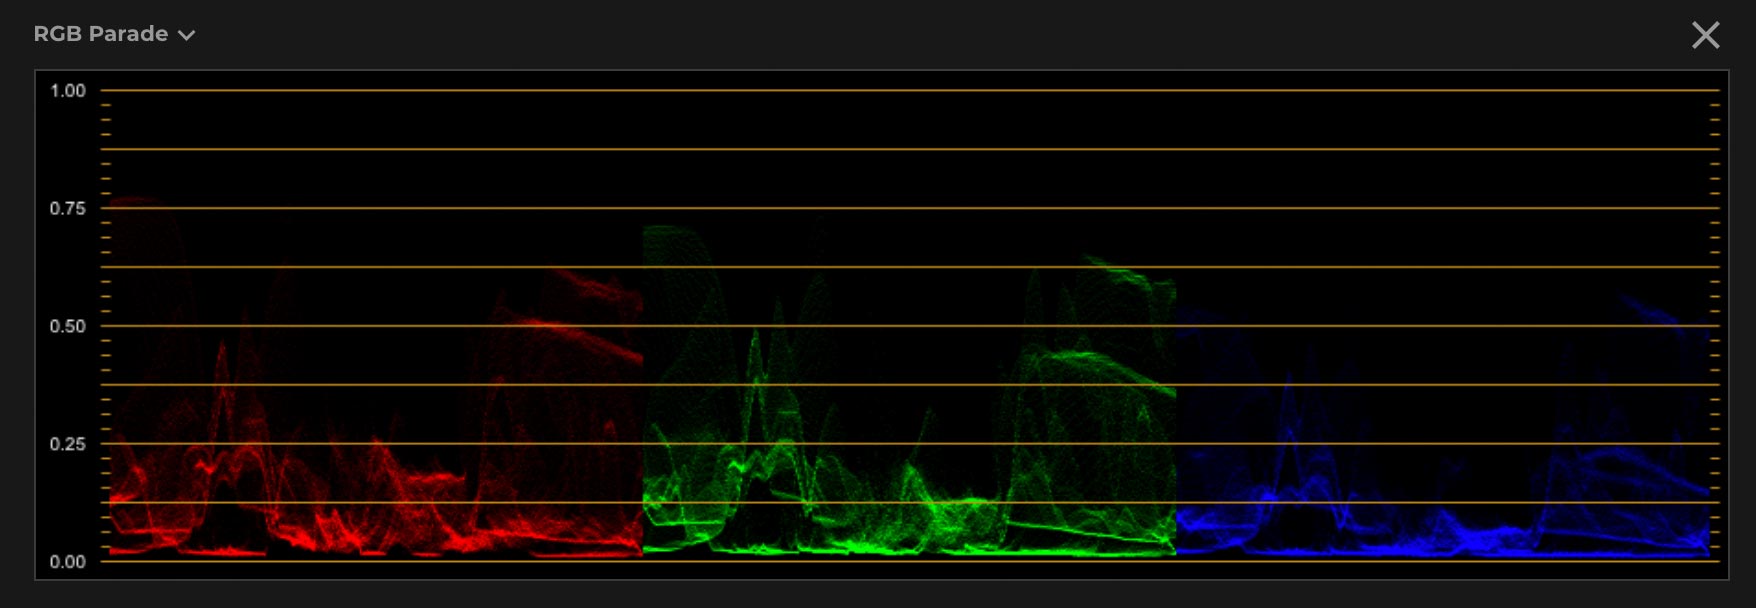
If we adjust the white balance control, we can see that the waveform channels now almost completely overlap.
And if we look at the image, it indeed appears far more correct.
Please note that not always you want your channels to overlap in the waveform. Everything depends on your shooting conditions and the desired effect.
RGB Parade
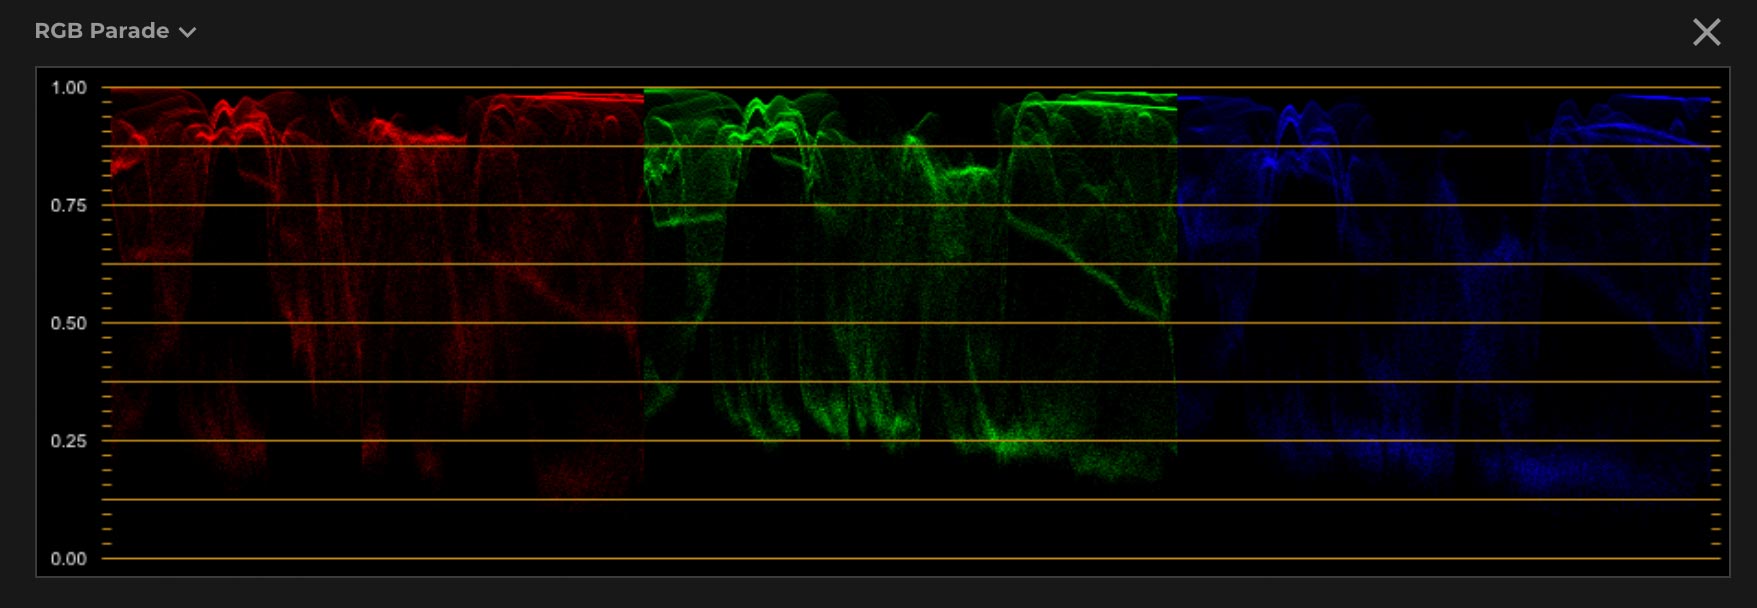
RGB Parade is similar to Waveform except that all RGB channels are displayed one next to each other. Each “column” represents the entire width of the image and shows the brightness distribution in a particular channel.
Underexposed image
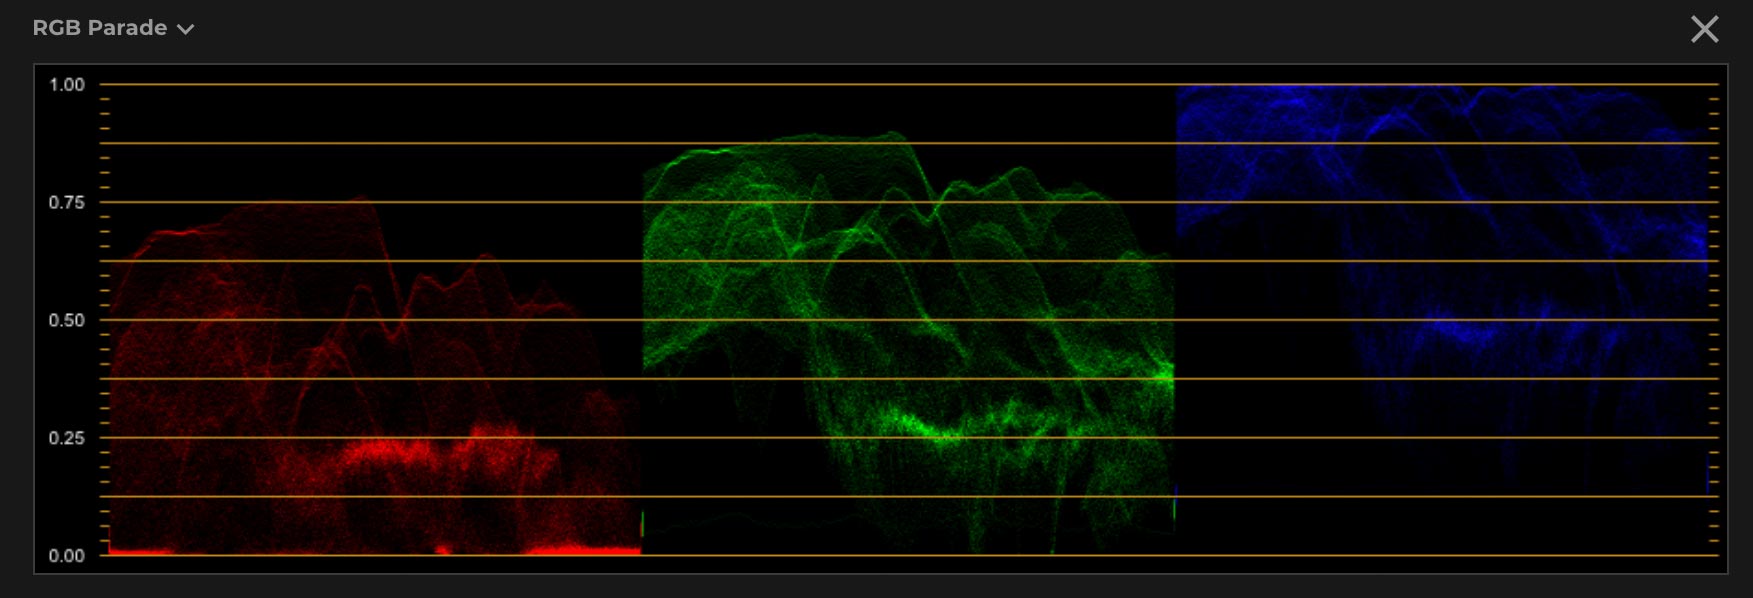
Overexposed image
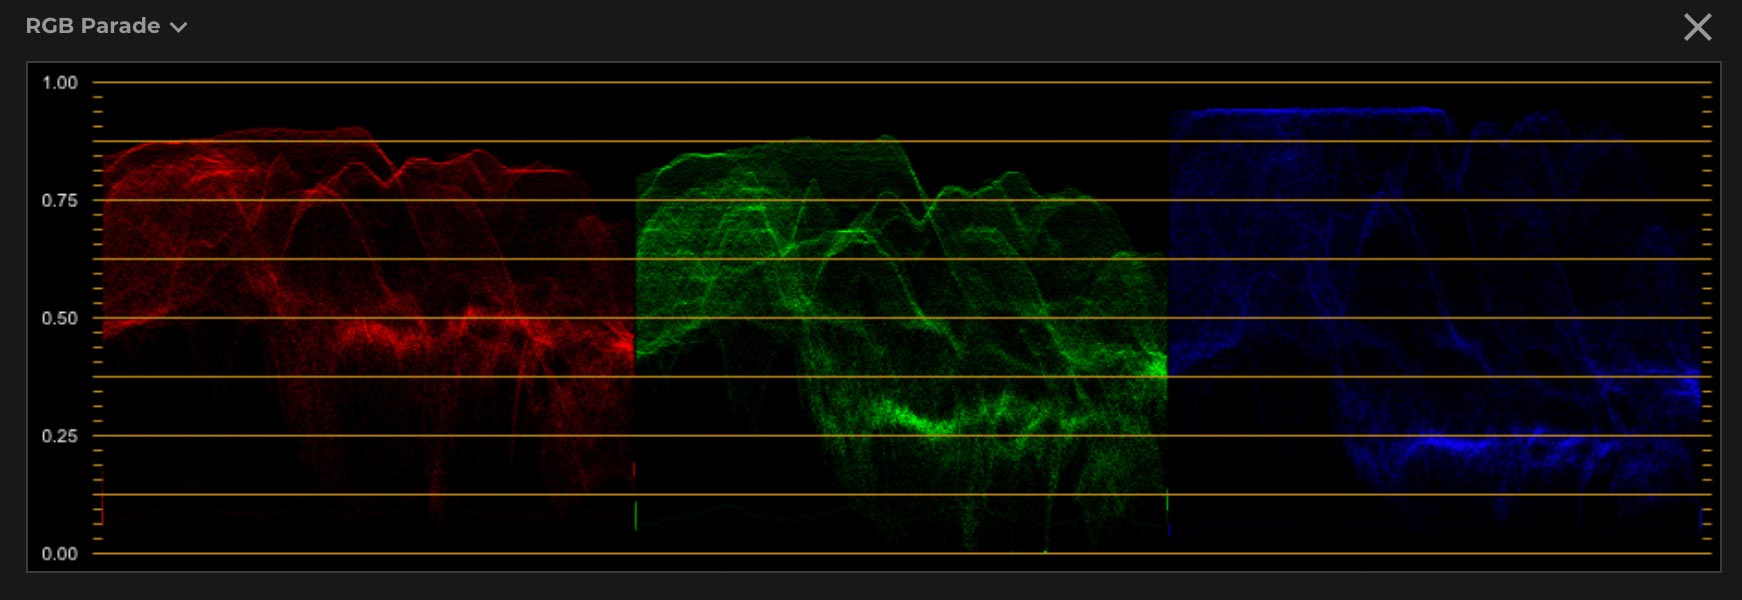
Correctly exposed image

Incorrect white balance
Correct white balance
Vectorscope
Vectorscope allows you to measure the hue and saturation of the colours in your image. Typically you will use vectorscope when adjusting skin tone and other memory colours, and when check the saturation of a color.
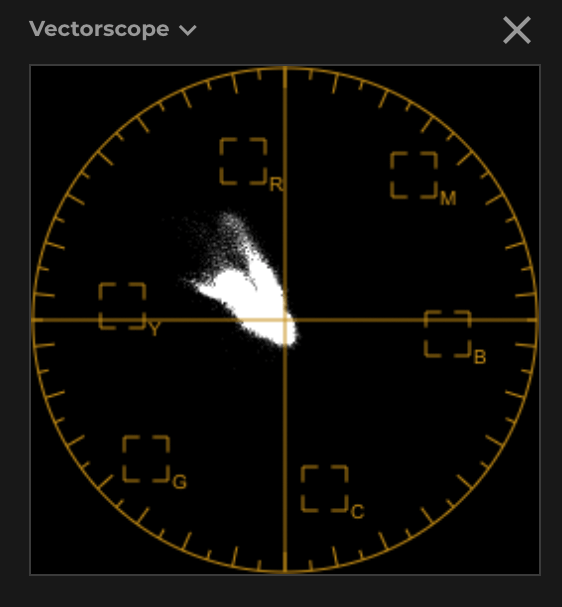
Distance
The distance of the graph from centre, tells you how saturated the colour is. A dot in the very middle means the image is black and white as it has no saturation. A graph that touches the edges and clips along the edge has exceeded the saturation visible by the selected Output Device Transform.
Angle
The angle of the trace in the vectorscope tells you the hue of the pixels in your image. The brighter the scope is in a particular angle the more pixels of that hue your image has.
Between the yellow and red vectors (closer to the red vector) is the “skin tone line”. A rule of thumb states that skin tones of any colour should point in the direction of the skin tone line. This is just a guide though and you sometimes may not want to follow the rules.
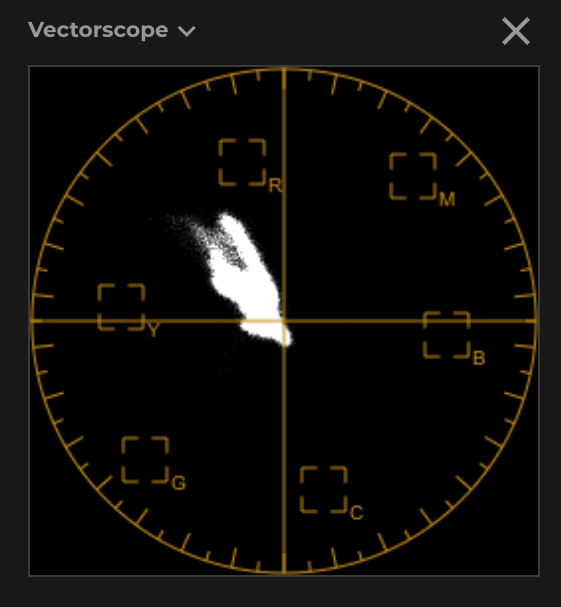
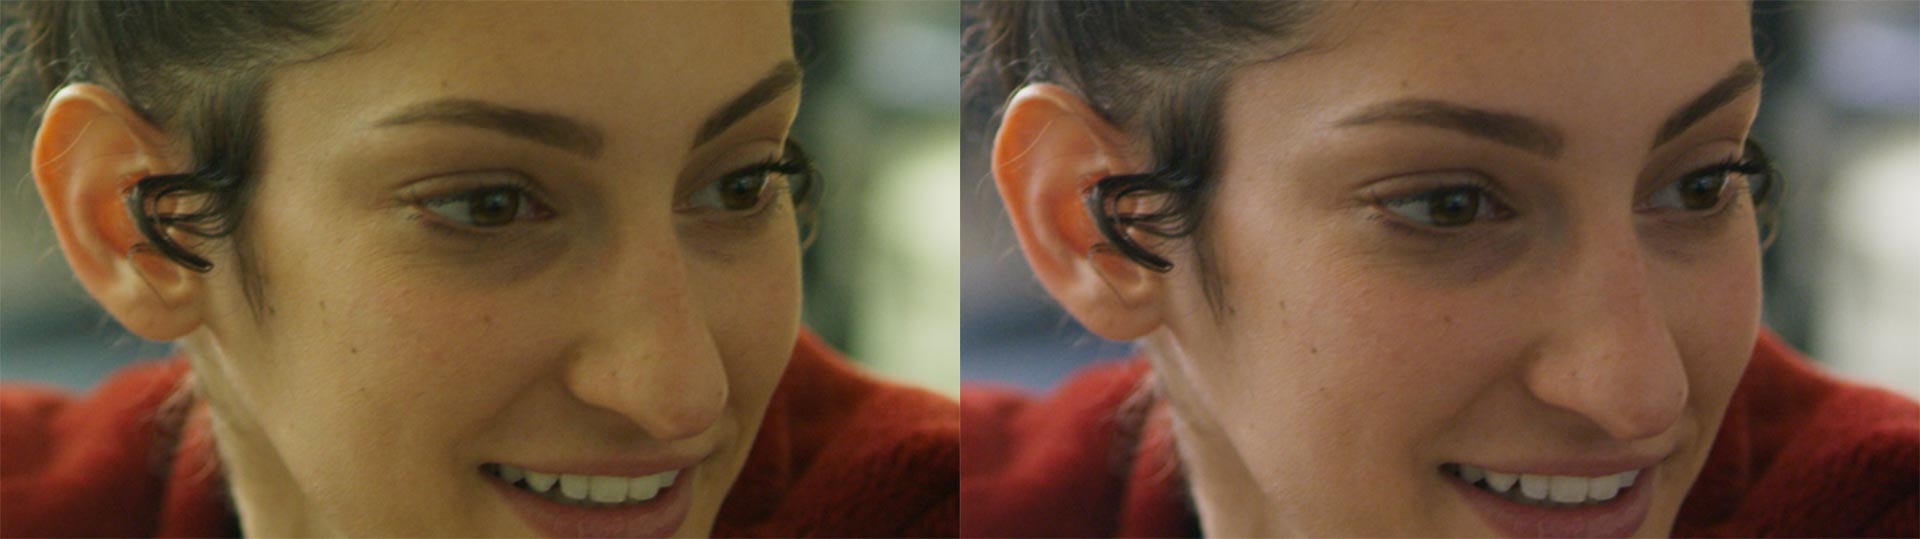
Following is an image of skin tone approximately following the skin tone line but it is a bit leaning toward the yellow vector.
And here is an image of skin tone more closely following the skin tone line.
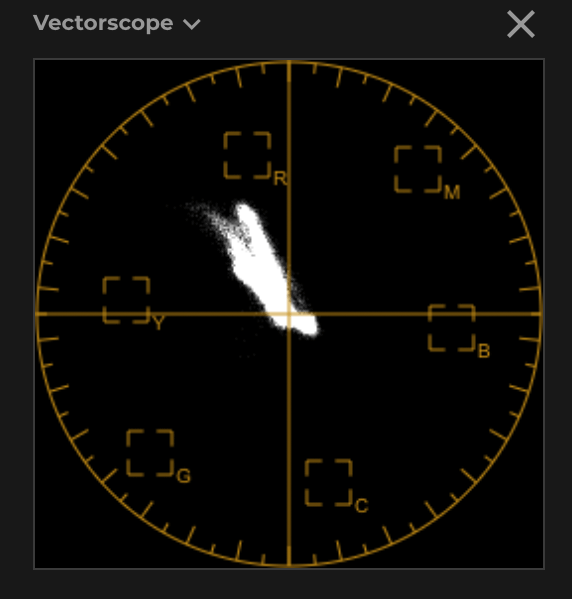
As you can see the appearance of the skin tone is different and looks more natural in the right image which represents the second vectorscope, the one that more closely follows the skin tone line. The yellow-ish cast from the first image is gone.
Please note that vectorscope will measure whatever is displayed in the main viewer area so if you want to check out skin tone values, you should zoom into the skin tone area in the main viewer area, such as the face.